banner_market_intelligence_1440x441

MARKET TREND ANALYSIS

Weekly Energy Market Updates by Region


Issue week: July 1st, 2022  (Wk 26)


POWER MARKETS

Chart1_Energy_Market_Intelligence_Commercial


WEST  Throughout June, the Day Ahead LMP has averaged around $70/MWh in CAISO and $22/MWh in Mid-C. That massive spread is attributable to the robust hydro generation in the Pacific Northwest, which peaked above 20 GW in the last two weeks. In contrast, above-average temperatures and formidable spot prices for natural gas kept index prices elevated all month long in California. In the forward market, today’s substantial dip in the NYMEX forward curve precipitated a drop of approximately $8/MWh in the SP15 forward curve for Q3 since last Friday.

ERCOT  Term prices have been mostly lower out the curve this week as higher natural gas prices have been more than offset by lower heat rates. Real-time prices have also moderated with the more seasonable weather that has emerged over the past few days, although the monthly real-time averages in the Houston and North Load Zones are still in the mid-$60s/MWh, nearly 50% above those of June 2021.

EAST Prices are again higher in the Midwest than in the Northeast this week. Indeed, the peak average is $99/MWh in PJM but only $83/MWh in NYISO and $75/MWh in ISO-NE. Heat will surely stimulate demand across the Midwest and along the Eastern Seaboard on Friday before the fever breaks over the holiday weekend.


NATURAL GAS 

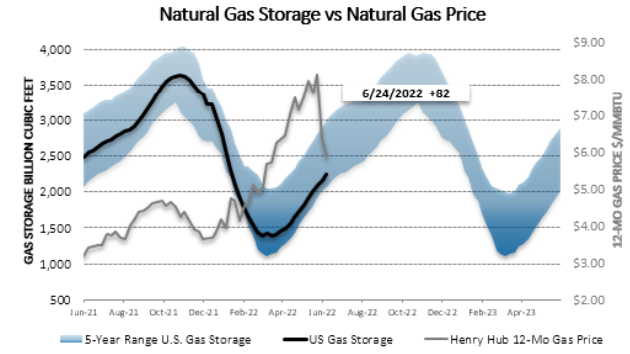
The EIA reported Thursday morning that, for the week ending June 24, U.S. inventories increased by 82 Bcf, nearly 11% greater than the anticipated endowment of 74 Bcf. Total stockpiles now stand at 2,251 Bcf, down by 11.6% from a year ago and 12.5% below the five-year average for the same week.

Marking the third consecutive week of at least a 13% drop from the previous week for prompt months, the new NYMEX futures prompt month of August ended today at $5.424/MMBtu, $1.074/MMBtu under yesterday’s close and $0.815/MMBtu shy of last Thursday’s finish. In fact, this is the first time that a prompt month has traded below $6/MMBtu in two months. The strong injection was largely responsible for the bearish move.

Map1_Energy_Market_Intelligence_Commercial


Chart1

Map1


Previous Weekly Market Reports: Archive


Disclaimer: This report is for informational purposes only and all actions and judgments taken in response to it are recipient’s sole responsibility. Champion Energy Services does not guaranty its accuracy. This reports is provided ‘as is’. Champion Energy Services makes no expressed or implied representations or warranties of any kind. Except as otherwise indicated in this report, this report shall remain the sole and exclusive property of Champion Energy Services and shall be free from any claim or right, license, title or interest. Champion Energy Services shall not be liable for any direct, indirect, incidental, consequential, special or exemplary damages or lost profit resulting from this report.