banner_market_intelligence_1440x441

MARKET TREND ANALYSIS

Weekly Energy Market Updates by Region


Issue week: June 17th, 2022  (Wk 24)


POWER MARKETS

Chart1_Energy_Market_Intelligence_Commercial


WEST  The strong precipitation over the past few months in the Pacific Northwest has paid off in above-average hydro generation throughout the first half of June and significantly suppressed the Day Ahead LMP in Mid-C. This week, Day Ahead prices in Mid-C have averaged around $9.00/MWh, substantially less than the average weekly settle in SP15, which has been around $71/MWh. In the forward market, news of the Freeport LNG facility’s closure for three months has pulled not only natural gas prices but also spot prices for Bal-2022 down significantly.

ERCOT  Despite both record peak loads due to blistering heat across the state and spot natural gas prices over $7/MMBtu, 7x24 real-time prices have been relatively low this week in all zones except Houston. Whereas strong wind and solar generation in the West has kept real-time prices between $40/MWh and $60/MWh in all of the other zones, Houston’s average has hovered right around $100/MWh as its outages have increased from 2,500 MW to 4,000 MW. Over in the term market, forward prices are down from last week on lower NG prices. Prompt 12-month 7x24 prices retreated by approximately $10/MWh on news that the Freeport LNG plant will likely not return to full service until the end of the year, but they have since regained $3/MWh as NG has partially rebounded.

EAST Summer is off to a strong start across the PJM footprint. The Real Time on-peak average in the Western Hub so far this week is $261.01/MWh. Amid near-record heat across the Midwest, demand has increased much more in PJM than in NYISO and ISO-NE. Consequently, Real-Time prices have blown up in the evening hours and produced large negative DART spreads. In Dayton, for example, Day Ahead trails Real Time by an average of $60.68/MWh.


NATURAL GAS 

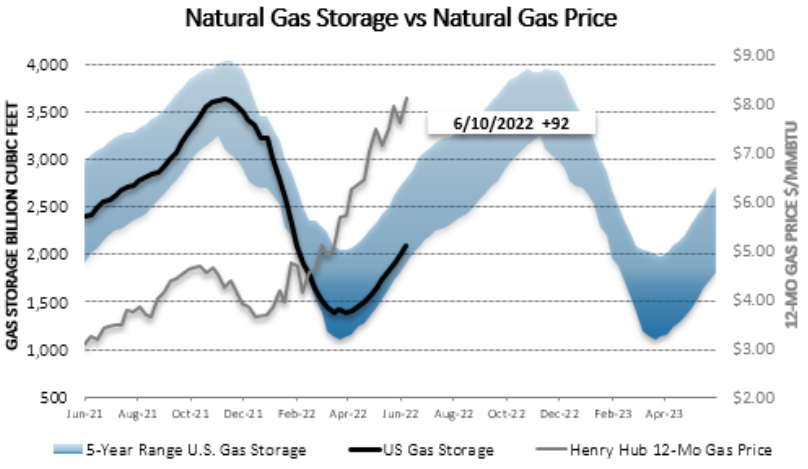
The EIA reported Thursday morning that, for the week ending June 10, U.S. inventories increased by 92 Bcf, greatly outperforming the expected gain of 82 Bcf. Total stockpiles now stand at 2,095 Bcf, down by 13.6% from a year ago and 13.4% below the five-year average for the same week.

The NYMEX futures prompt month of July ended today at $7.464/MMBtu today, $0.044/MMBtu higher than yesterday’s finale but still a whopping $1.499/MMBtu and 16.7% short of last Thursday’s close. Although the Freeport LNG facility in Texas was originally estimated to be offline for only three weeks after last week’s explosion, Freeport announced today that it would actually take closer to three months to come back online. That news sent the market into one of the sharpest nosedives in recent history, for the gas that otherwise would have been liquefied for export overseas will instead find its way into domestic storage caverns, effectively increasing production figures in a highly bearish development.

Map1_Energy_Market_Intelligence_Commercial


Chart1

Map1


Previous Weekly Market Reports: Archive


Disclaimer: This report is for informational purposes only and all actions and judgments taken in response to it are recipient’s sole responsibility. Champion Energy Services does not guaranty its accuracy. This reports is provided ‘as is’. Champion Energy Services makes no expressed or implied representations or warranties of any kind. Except as otherwise indicated in this report, this report shall remain the sole and exclusive property of Champion Energy Services and shall be free from any claim or right, license, title or interest. Champion Energy Services shall not be liable for any direct, indirect, incidental, consequential, special or exemplary damages or lost profit resulting from this report.