banner_market_intelligence_1440x441

MARKET TREND ANALYSIS

Weekly Energy Market Updates by Region


Issue week: April 21st, 2022  (Wk 16)


POWER MARKETS

Chart1_Energy_Market_Intelligence_Commercial


WEST  Whereas, over the past five years, the Day Ahead averages for the month of April were around $23.50/MWh and $17.50/MWh in SP15 and Mid-C, respectively, they are more than double those figures so far this April at $54.25/MWh and $66.50/MWh. The strong spot prices continue to reflect the runaway rise in natural gas spot prices, which is driving up the marginal cost of power in the West. In the term market, forward prices are still trading in a volatile manner in response to large moves in the NYMEX forward curve.

ERCOT  The impressive rally in natural gas futures continues to ripple through term prices, although the impact has been felt mainly in the front of the curve this week. The rally has come so far so fast that some may think a bit of retracement is due in the front of the curve. Amid the strong gas prices and current high-drought conditions in South and West Texas, summer peak prices are around $150-$160/MWh. Meanwhile, real-time prices for the month are in the $50-$60/MWh range, led by the Houston Load Zone. The ORDC adder for the month is just over $3.50/MWh.

EAST Compared with last week’s prints, prices have stayed relatively stable. In all of the main hubs in PJM, MISO, and NYISO, averages are in the low $70s/MWh for Day Ahead and spanning the high $60s/MWh to mid-$70s/MWh for Real Time. ISO-NE is again the outlier, although, this time, its Day Ahead and Real Time averages are under those of the other ISOs at $63/MWh and $59/MWh, respectively.


NATURAL GAS 

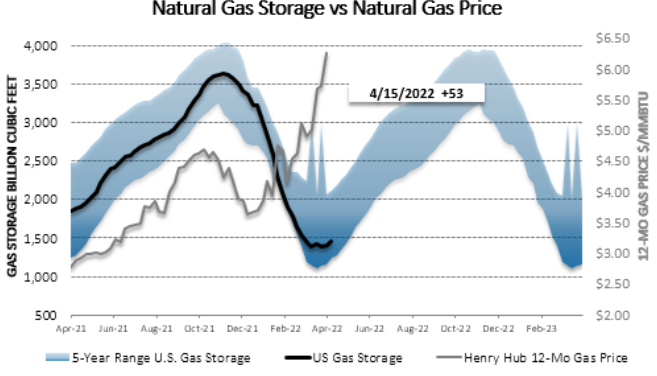
The EIA reported Thursday morning that, for the week ending April 15, U.S. inventories increased by 53 Bcf, more than 10% over the anticipated deposit of 48 Bcf. Total stockpiles now stand at 1,447 Bcf, down by 22.8% from a year ago and 16.8% below the five-year average for the same week.

At $6.957/MMBtu, the NYMEX Henry Hub prompt month of May finished today $0.020/MMBtu above yesterday but still $0.343 below last Thursday. Nonetheless, that that strip actually reached $8.055/MMBtu on Monday plainly demonstrates the ongoing volatility in the market for this commodity. Lower-than-average stores and growing demand are still the main drivers of moves to procure molecules ahead of this year’s summer and winter peaks. Finally, the outer years of 2023 and beyond are trading at a 25%-40% discount from the bal-year market and represent potential “value buys” at the moment.

Map1_Energy_Market_Intelligence_Commercial


Chart1

Map1


Previous Weekly Market Reports: Archive


Disclaimer: This report is for informational purposes only and all actions and judgments taken in response to it are recipient’s sole responsibility. Champion Energy Services does not guaranty its accuracy. This reports is provided ‘as is’. Champion Energy Services makes no expressed or implied representations or warranties of any kind. Except as otherwise indicated in this report, this report shall remain the sole and exclusive property of Champion Energy Services and shall be free from any claim or right, license, title or interest. Champion Energy Services shall not be liable for any direct, indirect, incidental, consequential, special or exemplary damages or lost profit resulting from this report.