banner_market_intelligence_1440x441

MARKET TREND ANALYSIS

Weekly Energy Market Updates by Region


Issue week: April 14th, 2022  (Wk 15)


POWER MARKETS

Chart1_Energy_Market_Intelligence_Commercial


WEST  Throughout the first half of April, Day Ahead prices been strong, nourished not only by high spot prices for natural gas but also by unseasonable temperatures. This week’s unusual cold in the Pacific Northwest has actually lifted spot prices in Mid-C above those in CAISO: Since last Friday, Day Ahead averages are around $67/MWh in Mid-C and $54/MWh in SP15. In the term market, forward prices throughout the region also continue to climb because of the unrelenting growth in the NYMEX forward curve.

ERCOT  Term prices continue to climb in the front of the curve, mainly because term prices for natural gas keep doing so as well. Indeed, BY 2022 is in the mid-$80s/MWh, $10/MWh higher than last week, and CY 2023 is up by $5-$6/MWh. Meanwhile, real-time prices remain firm as the MTD averages in the Houston Load Zone and South Load Zone are above $60/MWh amid seasonal outages, line congestion, and variability in output from renewable generators. Although temperatures are projected to be normal to below normal over the next 10 days, they nonetheless have been rising in a sign of the beginnings of cooling season, which will start to magnify demand.

EAST Increases in natural gas prices and maintenance-related generator outages have pushed index prices above seasonal norms and into the $70s/MWh this week. Prices may stay elevated into next week as cold weather moves across the Midwest and through the Northeast.


NATURAL GAS 

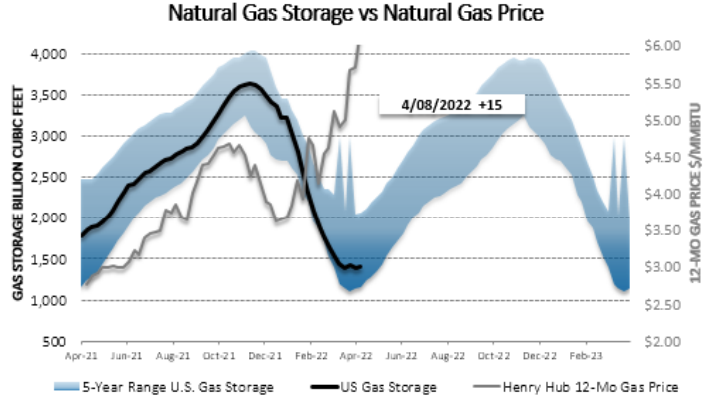
The EIA reported Thursday morning that, for the week ending April 8, U.S. inventories increased by 15 Bcf, whereas the industry had expected them to grow by 28 Bcf. Total stockpiles now stand at 1,397 Bcf, down by 23.9% from a year ago and 17.8% below the five-year average for the same week.

The NYMEX Henry Hub prompt month of May settled today at $7.300/MMBtu, $0.303/MMBtu higher than yesterday’s close and nearly a dollar ($0.961/MMBtu) over last Thursday’s. This marks the fifth consecutive week of increases of at least $0.24/MMBtu. In fact, the price for May has grown by an average of $0.325/MMBtu per week since March 17. Worldwide demand for energy overall and U.S. LNG in particular continues to drive prices higher throughout the strip, although strong backwardation persists in the forward years as 2023 and 2024 currently trade at a 25% discount and a 40% discount, respectively, from 2022.

Map1_Energy_Market_Intelligence_Commercial


Chart1

Map1


Previous Weekly Market Reports: Archive


Disclaimer: This report is for informational purposes only and all actions and judgments taken in response to it are recipient’s sole responsibility. Champion Energy Services does not guaranty its accuracy. This reports is provided ‘as is’. Champion Energy Services makes no expressed or implied representations or warranties of any kind. Except as otherwise indicated in this report, this report shall remain the sole and exclusive property of Champion Energy Services and shall be free from any claim or right, license, title or interest. Champion Energy Services shall not be liable for any direct, indirect, incidental, consequential, special or exemplary damages or lost profit resulting from this report.