POWER MARKETS

WEST Volatility in the CAISO Real Time market was strong last Saturday and Sunday after the AC transmission line connecting the Pacific Northwest to Northern California was derated by 4,200 MW from HE 9 on Saturday morning through HE 20 on Sunday night. The resultant drop in imports during the morning and nightly ramp drove the Real Time average LMP in NP15 to $175/MWh for those days. Meanwhile, the rise in the NYMEX forward curve has lifted the forward curve for all of the regional pricing hubs this week.
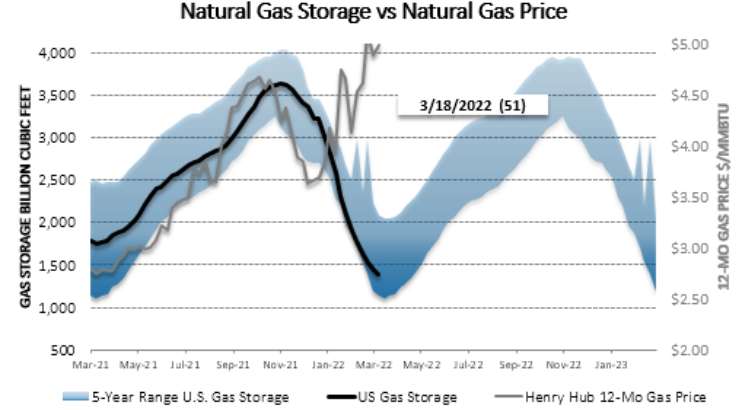
ERCOT Averaging around $25/MWh, real-time prices have been relatively subdued this week. Despite the loss of approximately 25,000 MW of generation for seasonal maintenance, mild weather and strong wind generation have kept prices relatively low. However, prices in just the West and Houston Load Zones are averaging around $35/MWh, thanks to congestion typical for this time of year as a result of the usual plant and line maintenance. Although warmer weather is forecasted for the next week or so, wind generation is projected to remain robust, so hub prices should remain relatively stable. Nonetheless, congestion will likely continue while plants remain down. In the term market, CY strips keep rising on the continuing surge in natural gas prices; the prompt 12-month, 24-month, and 36-month strips are up by $4/MWh, $3/MWh, and $2/MWh, respectively, since last week. Even with the higher natural gas prices, summer heat rates are holding relatively firm, but summer prices could still take a bullish turn as drought conditions develop over central and western Texas.
EAST Prices have continued their downward trend and are averaging in the $40s/MWh across the board. This week, Day Ahead is averaging $44/MWh while the Real Time average is lower by less than $1/MWh. In NYISO and ISO-NE especially, prices have finally calmed down and are in line with the other ISOs in the region.