banner_market_intelligence_1440x441

MARKET TREND ANALYSIS

Weekly Energy Market Updates by Region


Issue week: January 6th, 2022  (Wk 1)


POWER MARKETS

Chart1_Energy_Market_Intelligence_Commercial


WEST  Over the course of December, Day Ahead prices averaged around $60/MWh in CAISO and $50/MWh in Mid-C. The historically strong snowpack accumulation continued through the end of the month to raise the 2022 Pacific Northwest Summer Water Supply Forecast further to 104% of normal. Accordingly, forward prices have fallen as the heavy snowpack has reduced fears of feeble hydro generation over the summer.

ERCOT  Despite the first sub-freezing temperatures across most of the state early this week, 7x24 real-time prices have been relatively tame, averaging in the low $20s/MWh in all regions except the West, where they have averaged around $17/MWh for the year to date. If temperatures are as mild as forecasted for the next couple of weeks, real-time prices should find little support in the short term. In the term market, CY22 prices have continued to retreat, contracting by approximately $0.60/MWh since the end of the year, mostly on softening heat rates despite relatively steady NG prices. Given the steep selloff in forwards since October, CY strips are likely setting a floor in the short term and present the best buying opportunity of the last few months.

EAST LMPs have become much more volatile this week, thanks to cold weather in the Northeast. DART spreads there have been higher than seen recently; Real Time is $9/MWh higher than Day Ahead in ISO-NE’s Mass Hub and $18/MWh above Day Ahead in NYISO’s Hudson Valley and NYC. In the Midwest, PJM’s West Hub and MISO’s Indy Hub have stayed relatively stable in the high $30s/MWh with minimal DART spreads.


NATURAL GAS 

The EIA reported Thursday morning that, for the week ending December 31, U.S. inventories decreased by 31 Bcf, 40% less than the expected shrinkage of 52 Bcf. Total stockpiles now stand at 3,195 Bcf, down by 4.6% from a year ago but 3.1% above the five-year average for the same week.

The NYMEX Henry Hub prompt month of February settled today at $3.810/MMBtu, $0.072/MMBtu below yesterday’s close but $0.080/MMBtu higher than the final print of 2021. Weather models signaling the absence of extreme cold in the foreseeable future have kept that contract under $4/MMBtu since its big plunge around this time last month.


Chart1

Map1

Map2

Chart2


Map1_Energy_Market_Intelligence_Commercial


WASTE GOING TO ENERGY, OR ENERGY GOING TO WASTE?

One cost-effective energy source currently harnessed in much of the developed world is municipal solid waste (MSW). As the U.S. Energy Information Administration (EIA) explains, MSW contains a mix of materials, both biogenic (such as paper, food scraps, and leaves) and non-biomass (such as plastics and petroleum-based products), that can be burned in specially equipped waste-to-energy (WTE) facilities to generate electricity. Compiling data from the Organization for Economic Cooperation and Development, the graph below from the EIA demonstrates the considerable extent to which many nations have embraced WTE not only to provide power but also to minimize the amount of MSW occupying their limited space. For example, Denmark, Norway, and Sweden converted half of their MSW into electricity in 2019, and Japan extracted energy from almost 75% of its refuse in 2018.

Chart4_Energy_Market_Intelligence_Commercial

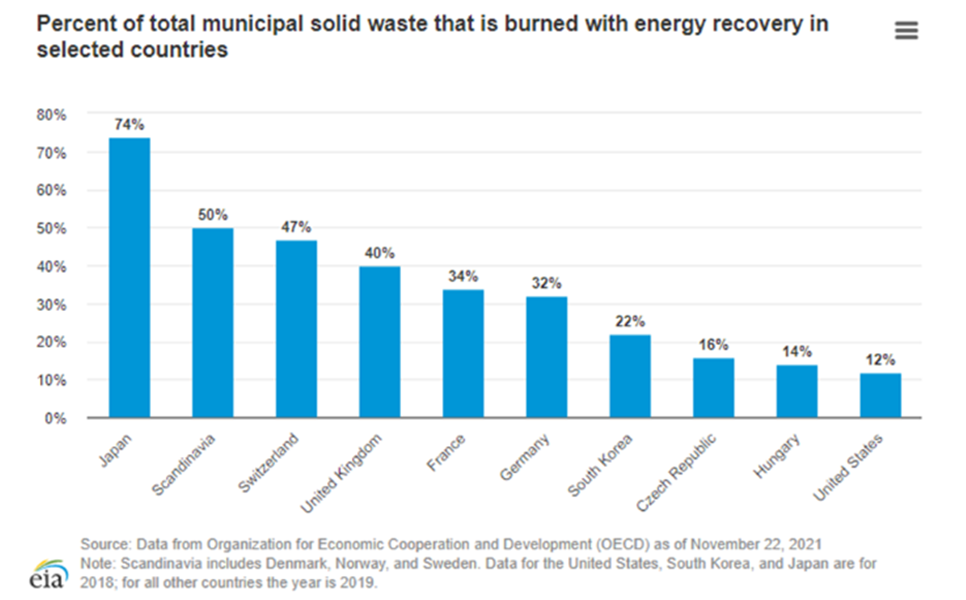
Last July, Statista’s Ian Tiseo projected the value of the global WTE market to reach $50.1 billion by 2027. With its vast landfills full of fuel for these generators, the U.S. arguably has the greatest potential for expansion of the technology, but its share of that pie may instead be shrinking. Although a total of 65 U.S. WTE power plants generated approximately 13.5 million MWh from 25 million tons of MSW in 2020, the U.S. was last in the EIA graph above, leaving 88% of its MSW untapped in 2018. Furthermore, Arlene Karidis of Waste360 observed that 12 WTE facilities in the U.S. closed between 2009 and 2019.”

The viability of WTE generation as a reliable energy source is undeniable, but, as Ms. Karidis notes, the gauntlet of low electricity prices, stringent permitting and regulatory demands, and public skepticism of its impact on the environment may prevent its growth in the U.S. Fortunately, the inclusion of WTE power alongside wind- and solar-generated electricity for certain states’ renewable energy credits (RECs), such as Maryland’s Tier 1 RECs, has improved that outlook. WTE generation already offers a way to achieve the popular objective of reducing landfills to prevent further blight in urban or marginalized areas. If the technology is ever upgraded to make the environment irrefutably cleaner, the energy sector will certainly not let it be thrown away.


Previous Weekly Market Reports: Archive


Disclaimer: This report is for informational purposes only and all actions and judgments taken in response to it are recipient’s sole responsibility. Champion Energy Services does not guaranty its accuracy. This reports is provided ‘as is’. Champion Energy Services makes no expressed or implied representations or warranties of any kind. Except as otherwise indicated in this report, this report shall remain the sole and exclusive property of Champion Energy Services and shall be free from any claim or right, license, title or interest. Champion Energy Services shall not be liable for any direct, indirect, incidental, consequential, special or exemplary damages or lost profit resulting from this report.