banner_market_intelligence_1440x441

MARKET TREND ANALYSIS

Weekly Energy Market Updates by Region


Issue week: September 23rd, 2021  (Wk 38)


POWER MARKETS

Chart1_Energy_Market_Intelligence_Commercial


WEST  In California, imports keep coming in from other balancing authorities during the ramp hours as CAISO continues to send price signals during those hours. Both the Desert Southwest and the Pacific Northwest have been cooler than average, so CAISO has been able to soak up all of those spare megawatts. In other developments, outage season is approaching and, as evidenced by the drop in output at the Palo Verde nuclear facility in yesterday’s report from the U.S. Nuclear Regulatory Commission, may have already started.

ERCOT  Although real-time prices for the week are up, thanks to a few triple-digit prices in key intervals, averages for the month to date are in the low-to-mid $40s/MWh, still well above the $20s/MWh of last September. Term prices have been mixed this week as increases in the back of the curve have offset slight decreases in the front. In addition, the ORDC adder for September is under $0.10/MWh. Although the bulk of the cooling-focused load is done, high near-term gas prices due to low inventories are a new concern as generators take key winterization steps to mitigate the potential fallout of another event like this February in the coming winter.

EAST Prices are solid across the Northeast and Midwest as we move into autumn. So far this week, PJM West Hub has averaged $45.58/MWh, the highest at this hub for this same week in the past five years. DART spreads in MISO have been mostly positive this week because of a dip in demand in the Real Time market due to cooler weather. In ISO-NE, Mass Hub is averaging a strong $54.57/MWh.


Chart1

Map1

Map2

Chart2


THE TANGLED WEB OF NATURAL GAS AND POWER PRICES

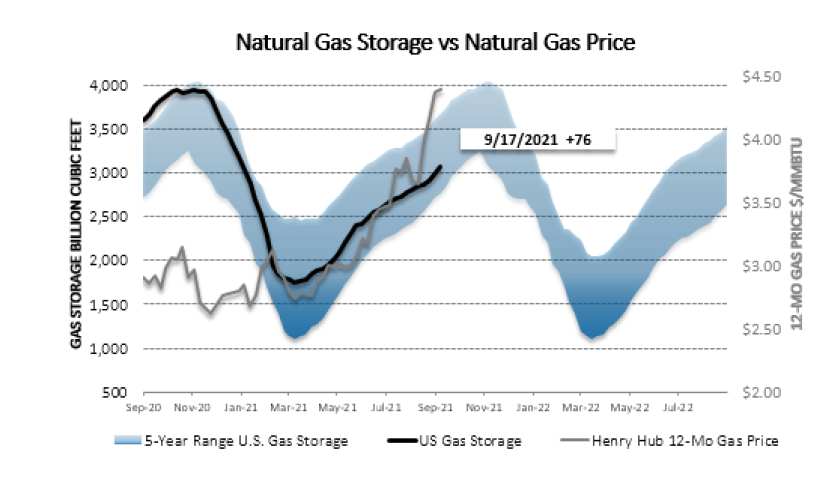
The wild run of natural gas prices was the story of this summer in the energy sector, the culmination of multiple factors. For example, the increase in the number of active rigs has not kept pace with the surge in demand, and gas inventories have been well below not only last year’s stockpiles but also rolling five-year averages. International price spikes have taken their toll on U.S. markets as well.

A casualty of this upheaval in natural gas has been index power prices. Indeed, the graphs below show that, for instance, the surge in Day Ahead prices in PJM West between last summer and this summer closely tracks that seen in spot prices for natural gas.

Chart4_Energy_Market_Intelligence_Commercial

The market is clearly fearful of a bullish winter, and the months historically known to be most susceptible to extreme price swings have not yet arrived. Therefore, now is as good a time as any for companies to protect themselves from even more extreme index prices, and Calpine Energy Solutions is prepared to help them optimize their risk management strategy as they head into that volatile period.


Previous Weekly Market Reports: Archive


Disclaimer: This report is for informational purposes only and all actions and judgments taken in response to it are recipient’s sole responsibility. Champion Energy Services does not guaranty its accuracy. This reports is provided ‘as is’. Champion Energy Services makes no expressed or implied representations or warranties of any kind. Except as otherwise indicated in this report, this report shall remain the sole and exclusive property of Champion Energy Services and shall be free from any claim or right, license, title or interest. Champion Energy Services shall not be liable for any direct, indirect, incidental, consequential, special or exemplary damages or lost profit resulting from this report.