POWER MARKETS

WEST The past two months were far from normal as above-average temperatures, trans-mission outages, and below-average hydro generation fostered strong price volatility across the entire Western Interconnect. Throughout July, Day Ahead prices averaged around $67/MWh in CAISO and $89/MWh in Mid-C. Ongoing wildfires continue to threaten the deration of important transmission lines, but the biggest risk in August is a heat wave in all parts of the region at the same time, which would raise demand considerably every-where and require extremely high price signals so marginal MW could flow where needed.
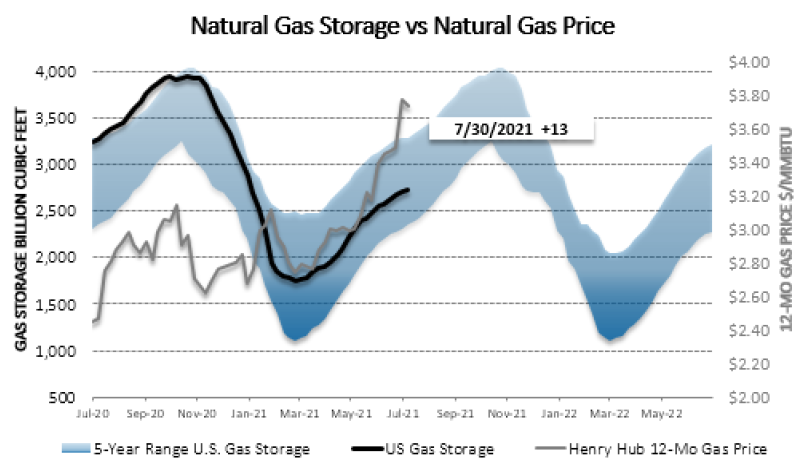
ERCOT Despite strong loads during the last week of July, the 7x24 real-time average for July ended up around $38/MWh, considerably lower than the $50/MWh where forward prices for July started the month. The mild start to August has kept the real-time average around $37/MWh this week. Accordingly, 7x24 prices for the balance of August have col-lapsed from approximately $75/MWh a week ago to approximately $50/MWh this week. Temperatures and loads across the state, however, are expected to rise this weekend and into early next week to inject some temporary volatility into the market. Despite the near-term selloff, forward prices down the curve remain strong on the heels of a continuing increase in NG prices. CY strips for 2022 and beyond are all up by $0.50-$1.00/MWh.
EAST Overall, Day Ahead and Real Time prices are lower than last week. DART spreads have been minimal in PJM’s West and NI Hubs, where both Day Ahead and Real Time prices are right around $35/MWh. In contrast, the Day Ahead average of $34/MWh in ISO-NE’s Mass Hub is $3/MWh more than Real Time. NYISO’s Hudson Valley also has a Day Ahead aver-age of $34/MWh, but Real Time there is only $1.40/MWh less. On the other hand, Day Ahead is averaging $37/MWh in MISO’s Indiana Hub, and the Real Time average is almost $3/MWh higher.