banner_market_intelligence_1440x441

MARKET TREND ANALYSIS

Weekly Energy Market Updates by Region - Archive


Issue week: June 17th, 2021  (Wk 24)


POWER MARKETS

Chart1_Energy_Market_Intelligence_Commercial


WEST  Excessive heat warnings have driven demand up across the Western Interconnection and, for reliability purposes, forced CAISO to cut exports to the Desert South-west, where the highest Day Ahead prices have been logged because of insufficient regional capacity to meet peak demand. The Palo Verde trading hub in Arizona and Mead hub in Nevada have had to send price signals high enough to incentivize non-CAISO-sourced power to flow into their regions. Consequently, the on-peak Day Ahead LMP cleared around $1,420/MWh today.

ERCOT  Term prices have been mixed this week, still trading well above last week’s levels despite retreating from the highs of this Monday and Tuesday. Summer heat rates have risen as demand has stayed high, intermittent resources have per-formed below expectations, more thermal units than expected are down, and natural gas prices have increased. Meanwhile, real-time prices rose this week on days 13 and 14 during the super-peak hours as typical summer conditions have materialized. In addition, the ORDC adder has climbed near $4.00/MWh, well above that of June 2019 and June 2020.

EAST Like the weather in some parts, prices have cooled off this week. Day Ahead has fallen by approximately $5/MWh in all main hubs except MISO’s Indiana Hub and PJM’s NI Hub. At Indiana Hub, where the weather remains hot, the Day Ahead average is $36/MWh (roughly $3/MWh above last week’s average) and the DART spread is almost zero. At NI Hub, both Day Ahead and Real Time have barely moved since last week, Day Ahead averaging $31/MWh and Real Time averaging $33/MWh.

Chart1

Map1

Map2

Chart2


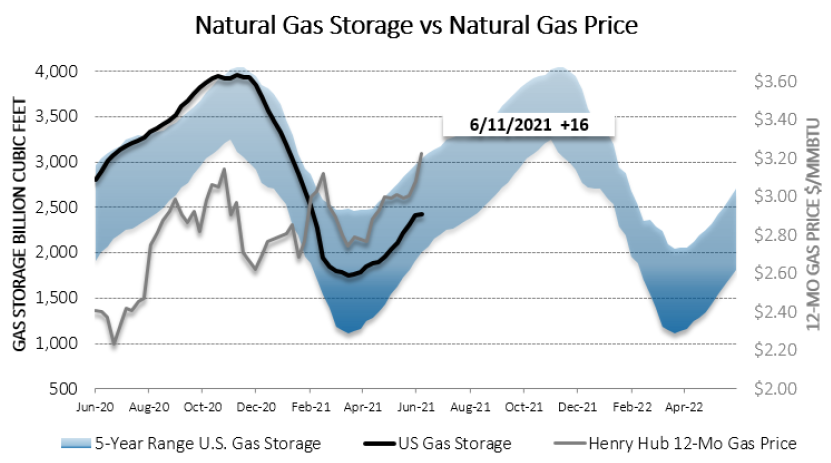
NATURAL GAS FEELING THE PRESSURE

Although the recent rebound in oil prices to $70 per bar-rel is surely traceable, at least in part, to a resurgence in demand so far in 2021, the biggest influence has been cuts in oil production by OPEC. By creating an opening for an increase in domestic oil production, this development has engendered optimism not only in U.S. oil producers but also in suppliers of natural gas, a natural by-product of oil. Indeed, the graph below from the U.S. Energy Information Administration shows that the number of operational natural gas rigs has grown steadily over the past 12 months after a huge contraction over the previous 18 months.

However, despite the proliferation of active rigs and re-cent strength of natural gas prices, uncertainty persists in the natural gas market for some reason, whether miscellaneous supply chain issues, ongoing political opposition to fossil fuels, or some other unforeseen cause. If the rig count shrinks again or natural gas supplies are otherwise threatened, energy prices for both natural gas and electricity could rise even higher than they currently are. As always, vigilance is prudent to weather price shocks.

Chart4_Energy_Market_Intelligence_Commercial


Previous Weekly Market Reports: Archive


Disclaimer: This report is for informational purposes only and all actions and judgments taken in response to it are recipient’s sole responsibility. Champion Energy Services does not guaranty its accuracy. This reports is provided ‘as is’. Champion Energy Services makes no expressed or implied representations or warranties of any kind. Except as otherwise indicated in this report, this report shall remain the sole and exclusive property of Champion Energy Services and shall be free from any claim or right, license, title or interest. Champion Energy Services shall not be liable for any direct, indirect, incidental, consequential, special or exemplary damages or lost profit resulting from this report.